
Liquid Flow Meter Performance and Specification Terms: A Guide
Liquid flowmeter performance can be demonstrated in several ways, and within the industry, there exists some imaginative specification writing. What is really meant by the word “performance?” What does a full-scale deflection (FSD) linearity actually mean? What about discrimination, uncertainty, and rangeability?
Calibration Uncertainty
How optimal a flowmeter’s calibration uncertainty is forms the basis of all performance claims. It is a figure seldom quoted other than by certified calibration houses. Even fully traceable calibrations can NOT be absolute as there is a degree of uncertainty on each measurement back to the national standards. Flow is a complex metric that depends on many variables, including pressure, density, temperature, compressibility, etc. These measurements affect the final calibration result. The best calibration houses claim an uncertainty of ±0.02%. However, ±0.1% is more typical. This is the value on which all other accuracy statements are founded. If the uncertainty claimed is ±0.2%, the meter cannot be considered more accurate than that, even if the repeatability and linearity are below ±0.1%; the basic calibration uncertainty is the overriding factor.

Accuracy
Accuracy is the deviation from the flowmeter reading. This figure includes linearity, repeatability, and calibration uncertainty values. As such, accuracy and repeatability are not the same.
Repeatability
Repeatability is the flowmeter’s ability to produce the same result on repeated runs under identical operating conditions — a concept not to be confused with accuracy or linearity. Without excellent repeatability, a flowmeter cannot achieve exceptional performance. Most of the time, multiple points are taken at each calibration point to verify repeatability, although these are not always reported on the calibration certificate. A highly-repeatable meter that can be calibrated in-situ could be ideal for situations like batching applications, where any offset can be accounted for.
Linearity
Linearity refers to a device’s ability to remain within defined limits over a specified flow range. The standard expression of linearity is “of reading” — this is where the percentage error at each flow rate within the operating range is specified. An alternative definition, used in various sections of the industry, is a percentage of full-scale deflection (FSD) linearity.
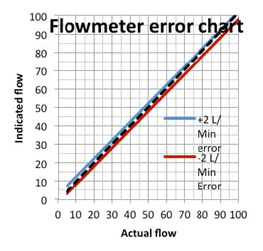
The linearity of this flowmeter looks good initially, as the plot of the indicated flow and the actual flow is nearly a straight line. This flowmeter is specified as ±2% of full-scale accuracy. Therefore, a ±2 liter per minute tolerance applies over the whole operating range. By plotting the number of pulses per liter for the same flowmeter against the flow rate, a different picture of the flowmeter’s linearity is evident.
Consequently, a ±2% FSD specification can be likened in using an indicator with only 0-100 digital display. All of the readings are in 1-unit steps, so at full flow, the error is ±2 lpm; the same is true at 10 liters per minute, which could be 8 or 12 lpm.

Individuals do not commonly claim a 100:1 flow range and a ±2% FSD linearity. However, this a compelling illustration of the potential issue. Even a 10:1 flow range with ±1% FSD would provide a 10% permissible error at the specified minimum flow.
In this performance graph, the error lines are shown as a reading percentage. The flowmeter “drops out” of the required accuracy at lower flows, and the dashed line crosses over the solid red lower limit line.

The linearity percentage “of reading” graphs more effectively illustrate the actual circumstance. The meter is near the maximum acceptable limit at full flow, yet drops outside the ±2% of reading specification around 20 liters per minute.

The above figure is a standard calibration graph issued by a flowmeter manufacturer showcasing the permissible errors. In this case, the specification is 0 to 1 liter per minute, ±0.5% of reading. This meter exceeds the specification by having linearity of +0.28% -0.1% — including both flow meter and calibration rig repeatability.
Discrimination
A flowmeter’s discrimination determines how small of a measurement it is possible to make. Discrimination (also referred to as resolution) has nothing to do with accuracy. For example, a flowmeter that only gives one pulse per liter may do it between 0.999 and 1.001 liters for every pulse of 0.1% accuracy, but poor discrimination.
Rangeability
Rangeability is the ratio of minimum to maximum flow and is often dependent on the flow meter technology utilized, the flow rate, and application. Certain flowmeters in a production process might be required to measure flow accurately at an almost constant flow. In this instance, the range of the meter may only be 4:1. However, the accuracy over that range could be ±0.2%. By comparison, flowmeters for use on pilot plants, or as general tools in research, may require a 100:1 range but only a ±1% accuracy.
For additional information on flow meter systems, contact JLC International today.